mobsf-cli is a wrapper for the Mobile Security Framework (MobSF) REST-API. Created especially for Continuous
Integration (CI) / Continuous Delivery (CD) stages. You can use only use one command to upload a file, auto start scan,
save reports, check scores.
Mobile Security Framework (MobSF) is an automated,
all-in-one mobile application (Android/iOS/Windows) pen-testing, malware analysis and security assessment framework
capable of performing static and dynamic analysis.
mobsf-cli 0.1.0
Wojciech Zurek <mail@wojciechzurek.eu>
mobsf-cli app
USAGE:
mobsf-cli [OPTIONS] <SUBCOMMAND>
OPTIONS:
-a<api_key> Api key/token (overrides MOBSF_API_KEY env)
-h, --help Print help information
-s<server> Server, example: http://localhost:8000 (overrides MOBSF_SERVER env)
-V, --version Print version information
SUBCOMMANDS:
ci For CI/CD stages. Upload a file, auto start scan, save reports, check scores.
delete Delete scan.
help Print this message or the help of the given subcommand(s)
play Upload a fileand auto start scan.
report Get report.
scan Scan a file.
scans Display recent scans.
source View source files.
upload Upload a file.
Example usage
# Upload a file to MobSF server
mobsf-cli upload path/to/example.apk
# Scan a file
mobsf-cli scan apk example.apk <hash># Upload a file and auto start scan
mobsf-cli play path/to/example.apk
# Fetch scan result (report)
mobsf-cli report pdf <hash>
mobsf-cli report json <hash># Display recent scans
mobsf-cli scans
# Delete scan result
mobsf-cli delete <hash>
CI/CD usage
mobsf-cli ci combines:
upload a file,
start scan,
generate reports in pdf and json format,
check scan scores (cvss, security score, trackers) and rise an error if scores are wrong
# help
mobsf-cli ci --help

mobsf-cli-ci
For CI/CD stages. Upload a file, auto start scan, save reports, check scores.

USAGE:
    mobsf-cli ci [OPTIONS] -p <path_to_save> <file_path>

ARGS:
    <file_path>

OPTIONS:
    -a <api_key>             Api key/token (overrides MOBSF_API_KEY env)
    -c <cvss>                Above this score rise a cvss error. 0.0-10.0 [default: 3.9]
    -h, --help               Print help information
    -p <path_to_save>        Path to directory to save reports (pdf and json).
    -r                       Rescan a file
    -s <server>              Server, example: http://localhost:8000 (overrides MOBSF_SERVER env)
    -t <trackers>            Above this score rise a trackers error. 0-407 [default: 0]
    -u <security>            Below this score rise a security error. 0-100 [default: 71]
mobsf-cli ci path/to/example.apk -p path/to/save/reports -c 5.5 -u 48 -t 2
...
Validating scan scores...
Error: CVSS score [6.6] is to high. Max: 5.5!
A complete plugin for wardriving on your pwnagotchi. It saves all networks seen by bettercap, not only the ones whose handshakes has been collected. The plugin works on Evilsocket and Jayofelony images.
Support GPS coordinates retrieval from Bettercap, GPSD and Pwndroid application
Automatic and manual upload of wardriving sessions to WiGLE
Web UI with lots of information
Export single wardriving session in CSV
Label and icon on display with status information
🚀 Installation
Important
This plugin require a GPS module attached to your pwnagotchi to work, or your pwnagotchi needs to be connected via BT to your Android phone with Pwndroid application installed.
Depending on the GPS method choosen, you’ll also need the gps or gpsdeasy or pwndroid plugin enabled. For more info about GPS configuration, check the section below.
Login inside your pwnagotchi using SSH:
ssh pi@10.0.0.2
Add the plugin repository to your config.toml file and reboot your pwnagotchi:
Edit your configuration file (/etc/pwnagotchi/config.toml) and add the following:
# Enable the pluginmain.plugins.wardriver.enabled = true# Path where SQLite db will be savedmain.plugins.wardriver.path = "/root/wardriver"# Enable UI status textmain.plugins.wardriver.ui.enabled = true# Enable UI iconmain.plugins.wardriver.ui.icon = true# Set to true if black background, false if white backgroundmain.plugins.wardriver.ui.icon_reverse = false# Position of UI status textmain.plugins.wardriver.ui.position.x = 7main.plugins.wardriver.ui.position.y = 95# Enable WiGLE automatic file uploadingmain.plugins.wardriver.wigle.enabled = true# WiGLE API key (encoded)main.plugins.wardriver.wigle.api_key = "xyz..."# Enable commercial use of your reported datamain.plugins.wardriver.wigle.donate = false# OPTIONAL: networks whitelist aka don't log these networksmain.plugins.wardriver.whitelist = [
"network-1",
"network-2"
]
# NOTE: SSIDs in main.whitelist will always be ignored# GPS configurationmain.plugins.wardriver.gps.method = "bettercap"# or "gpsd" for gpsd or "pwndroid" for Pwndroid app
Restart daemon service:
sudo systemctl restart pwnagotchi
Done! Now the plugin is installed and is working.
Please note that during execution the plugin will download all the missing assets from GitHub if internet is available. For this reason, the first time you run the plugin you’ll not see any icon on your pwnagotchi’s screen.
📍 GPS Configuration
Starting from version v2.3, Wardriver supports different methods to retrieve the GPS position. Currently it supports:
Bettercap: getting the position directly from Bettercap’s agent
GPSD: getting the position from GPSD daemon
Pwndroid: getting the position from pwndroid Android companion application
Check one of the below section to understand how to configure each method for GPS position.
🥷 Bettercap
If you are using the default gps plugin that add the GPS data to Bettercap, pick and use this method. This is the default and the fallback choice, if you don’t specify something else in the config.toml.
If you are using Rai’s gpsd-easy or Fmatray’s gpsd-ng, pick and use this method. This should be used if you have installed gpsd on your pwnagotchi and if it is running as a daemon.
# ...main.plugins.wardriver.gps.method = "gpsd"# OPTIONAL: if the gpsd daemon is running on another host, specify here the IP address.# By default, localhost is usedmain.plugins.wardriver.gps.host = "127.0.0.1"# OPTIONAL: if the gpsd daemon is running on another host, specify here the port number.# By default, 2947 is usedmain.plugins.wardriver.gps.port = 2947# ...
📱 Pwndroid
Important
Be sure to have websockets pip library installed. Run sudo apt install python3-websockets on your pwnagotchi.
If you don’t have a GPS device connected to your pwnagotchi, but you want to get the position from your Android phone, then pick this method. You should have installed the Jayofelony’s Pwndroid companion application.
# ...main.plugins.wardriver.gps.method = "pwndroid"# OPTIONAL: add the IP address of your phone. This should be changed ONLY if you have changed the BT network addresses.main.plugins.wardriver.gps.host = "192.168.44.1"# OPTIONAL: add the port number where the Pwndroid websocket is listening on. This shouldn't be changed, unless the# application is updated with a different configuration. By default, 8080 is usedmain.plugins.wardriver.gps.port = 8080# ...
🗺️ Wigle configuration
In order to be able to upload your discovered networks to WiGLE, you need to register a valid API key for your account. Follow these steps to get your key:
Add the value inside main.plugins.wardriver.wigle.api_key in /etc/pwnagotchi/config.toml file
You are good to go. You can test if the key is working by opening the wardriver web page and clicking on Stats tab. If you get your WiGLE profile with your stats, the API key is working fine.
🔥 Upgrade
If you have installed the plugin following the method described in the previous section, you can upgrade the plugin version with:
Otherwise, if you have installed the plugin manually just download the new version from GitHub and replace the old file on your pwnagotchi.
👾 Usage
Once configured, the plugin works autonomously and you don’t have to do anything. Check the sections below to learn more about how it works.
🖥️ Web UI
All the operations are done through the plugin’s Web UI. Inside of it, you can see the current wardriving session statistics, global statistics (including your WiGLE profile), all networks seen by your pwnagotchi and also plot the networks on map. You can upload automatically the sessions on WiGLE when internet is available, or upload them manually through the Web UI.
You can reach the Web UI by opening http://<pwnagotchi ip>:8080/plugins/wardriver in your browser.
🚗 Wardriving
Everytime bettercap refresh the access points list (normally every 2 minutes more or less), the plugin will log the new networks seen along with the latitude, longitude and altitude. Each time the service is restarted a new session will be created. If you have enabled it, the plugin will display the total number of networks of the current session on the pwnagotchi display.
If you don’t want some networks to be logged, you can add the SSID inside wardriver.whitelist array in the config. Wardriver does not report networks whose SSID is contained within the local and global whitelist.
Note: the SSIDs inside the main.whitelist array will always be ignored.
🌐 WiGLE upload
If you have enabled it, once internet is available, the plugin will upload all previous session files on WiGLE. Please note that the current session will not be uploaded as it is considered still in progress. Don’t worry, it’ll be uploaded the next time your pwnagotchi starts with internet connection.
If you just want to upload sessions to WiGLE manually you can still do it. All you have to do, is configuring your API key and use the corresponding button in the sessions tab of the Web UI. You can also download the CSV file locally for a specific session.
❤️ Contribution
If you need help or you want to suggest new ideas, you can open an issue here or you can join my Discord server using this invite.
If you want to contribute, you can fork the project and then open a pull request.
🥇 Credits
Rai68’s gpsd-easy pwnagotchi plugin for the GPSD integration
Jayofelony’s pwndroid pwnagotchi plugin for the Pwndroid integration
Update 2018: This project has been put on hold until Trading View released web hook support, as the SMS notifications were not open-ended and as such would expire, which would cause you to lose money because trades would cease if you forgot to renew the SMS hook, which was too manually fragile to justify maintaining.
Trading View strategies are added to the the Trading View interface, to see how they perform via Trading View’s backtesting feature
Trading View alerts are created via the study that accompanies the strategy (as Trading View strategies do not support alerts)
Use Trading View’s Server-Side SMS Alert feature to send the alert to a Twilio number
Use the Twilio number to send the message via Web Hook to a Firebase Function that parses it
Use the Firebase Function to act upon the alert message, with the usual intention of placing a trade via one or more intended Exchange APIs
That is to say, this is already a working solution for placing automated trades with various exchanges via Trading View strategies.
With enough effort, it will also accomplish:
Storage of trade data for historical reporting of profit and loss against strategies and securities
Storage of market data for more advanced strategies that can be operated independently of Trading View
An app that allows users to register, browse strategy performance, and connect their portfolios to the strategies
A marketplace for acquiring and renting strategies (%/$ on profits/month/trade)
Public/Private user profiles, automated trade performance, and portfolio size
Difficulties with this vision are:
Trading View offers no API for
injecting strategies against securities
injecting alerts on those strategies
In order for Trading View to successfully send an alert, it requires a perfect balance of:
Correct strategy and study setup, including correct input options
Correct chart and change duration setup
Correct connection between the strategy and the chart for correct alert setup
Ensuring that none of this automation configuration changes in the process of just using trading view for everyday things
A Premium Trading View plan in order to get access to their Server-Side SMS Alert feature, the only alert feature that sends alerts even when you have Trading View closed
Trading View has a few unexpected features/bugs:
Backtesting on Renko charts places realtime virtual trades at non-realtime prices, producing falsely optimal results
valuewhen(change(series), series, ForLoopIteration) does not seem to work as expected when inside a for loop, it seems to always produce the same result
There is no logging or debugging in pine script, which makes figuring out the unexpected implausible
This would be assisted by either:
Moving away from Trading View
This may happen in 2018, as currently other backtesting solutions seem of alpha quality
This would also allow potentially more advanced trading strategies, such as AI based ones
Working with Trading View to solve the earlier issues
A combination of both of the above; where this service evolves into an automated trading empire, where the strategies is a seperate empire which connects to this one, allowing any strategy service to connect to this user-facing (automated) trade placement solution
How to help:
Trading View strategies
You can help me improve my current strategies
You can write new strategies and add them
More exchanges
Feel free to add support for more exchanges, I will happily merge them
User-facing app
We can work together on the user facing app, that will allow users to register, add their exchanges, and view performance
Review
You can review what has been done and help me improve it, especially from a security perspective
Investment
You can help me connect a team/location/mentors/funds to build this out, make it into a product and a business, and hopefully double every user’s money while they sleep
I am not sure open-sourcing of this is a good or bad idea, as it could be I am naive, so here are my thoughts:
Bad idea:
someone more familiar with big finance takes an optimal strategy stored here, and sells it to big finance making millions of dollars without me, ruining my return on investment
some assumptions or code in this project could be fatally flawed, and someone decides to exploit it
Neutral idea:
a larger team takes the ambitions here, and makes the project happen without me — neutral return on investment, as I will still benefit from their result, even if my own investment was at a loss
individuals and firms may not trust the project with their money, unless they too can inspect its operations, which open-source provides – however, they could just fork it, and setup their own product based off it, using their big brand name as leverage
Good idea:
someone more familiar with big finance notices the potential in the project, and reaches out to help make it happen, offering expertise and/or funding and/or team suggestions
others also interested in this area help flesh this out, where one’s expertise in one area compliments another’s naiveity – this could be accomplished without open-source, but to do it without open-source, I’ll need to hire people, of which, I’ll need to find people to hire (first problem), and then to hire them (second problem)
some assumptions or code in this project could be fatally flawed, and someone else can spot it before it becomes more of a liability
the progress of strategies and implementation can be shared with support groups and other interested parties, to faciliate improvements and collaboration
See the INSTALL.md guide for how to setup this project yourself. Once there is a user-facing app, this will not be needed.
Disclaimer
This software is provided “as is”, without warranty of any kind, express or implied, including but not limited to the warranties of merchantability, fitness for a particular purpose and non-infringement. In no event shall the authors, copyright holders, or Bevry be liable for any claim, damages or other liability, whether in an action of contract, tort or otherwise, arising from, out of or in connection with the software or the use or other dealings in the software.
Use the software at your own risk. You are responsible for your own money. Past performance is not necessarily indicative of future results.
The authors and all affiliates assume no responsibility for your trading results.
This program is free software: you can redistribute it and/or modify
it under the terms of the GNU Affero General Public License as
published by the Free Software Foundation, either version 3 of the
License, or (at your option) any later version.
This program is distributed in the hope that it will be useful,
but WITHOUT ANY WARRANTY; without even the implied warranty of
MERCHANTABILITY or FITNESS FOR A PARTICULAR PURPOSE. See the
GNU Affero General Public License for more details.
You should have received a copy of the GNU Affero General Public License
along with this program. If not, see https://www.gnu.org/licenses/.
C++ implementation of lwm2m protocol client for use with RTL8710 MCU based devices.
Compiling/Flashing
Project built on PlatformIO core. Refer to PlatformIO documentation for detailed instructions on core installation and project configuration at: http://docs.platformio.org/en/latest/
Currently the project uses a custom PlatformIO platform, developed for Linux and Windows systems.
To compile project run:
platformio run
This command will download all libraries, tools, frameworks and platforms necessary to build, flash and debug the project.
To upload project run:
platformio run -t upload
Most RTL8710 based development boards include a CMSIS-DAP interface for device flashing and debugging, so proper driver installation might be needed.
Instructions on DAP firmware installation can be found here.
Lwm2m
The application uses the lwm2m protocol, and includes examples of how to implement GPIO, PWM, ADC, I2C and SPI features using lwm2m objects.
To choose between building SPI, I2C or ADC example uncomment the appropriate ‘#define’ – ‘SPI_MASTER_OBJ’, ‘I2C_MASTER_OBJ’ or ‘ADC_OBJ’. Only one of these objects can be used at the same time.
GPIO
Refer to lwm2m object id3312
Write 1/0 to resource ‘OnOff’ to set GPIO pin PA12 to either high or low.
PWM
Object id3306
Resource ‘OnOff’ turns PWM output on or off for pin PA_0.
‘Dimmer’ sets the duty cycle. Can be an integer value [0-100].
‘OnTime’ lets you specify a time in micro seconds that you want PWM to be on.
ADC
Object id3202
Read resource ‘AnalogInputCurrentValue’ to measure voltage on pin PA19.
SPI
Object id26241 (look for header file in ‘include’ directory)
‘Frequency’ specifies the SPI clock frequency.
‘Mode’ specifies SPI mode.
‘Buffer’ – data to be sent to SPI slave devices. Read this resource to get last received data from slave devices.
‘Length’ – received data length.
‘Transaction’ – once you have specified a data buffer, execute this resource to start SPI write command. ‘Buffer’ resource gets overwritten by data received from slaves.
I2C
Object id26241
‘Frequency’ specifies the I2C clock frequency.
‘Slave_address’ specifies I2C slave address.
‘Buffer’ – data to be sent to I2C slave devices. After read operation this resource is overwritten with data received from slaves. If you want read only operation, then buffer must be empty.
‘Length’ – if value is larger than 0 specifies number of bytes to be read, else specifies write only operation.
‘Transaction’ – execute this resource to start I2C write, read or write/read operation (depends on previously defined conditions).
Configuration
Once powered on the device connects to an access point and server configured inside its flash memory. Configuration is done with HTTP requests while the device is in access point mode. To switch device into AP mode pull UART_LOG_TX pin to ground for at least three seconds, on most developments boards this can be done by holding the ‘UART DOWNLOAD’ button.
Once connected to device AP, you can view the current configuration by sending a GET request to “http://[GATEWAY_ADDR]:80/ap”, ex.:
curl http://192.168.4.1:80/ap
To keep current configuration send a GET request to “http://[GATEWAY_ADDR]:80/keep”, ex.:
curl http://192.168.4.1:80/keep
To change current configuration send POST request to “http://[GATEWAY_ADDR]:80/ap”, with JSON payload, ex.:
This package contains the helper createTestPlans which can be used with xstate and @xstate/test.
createTestPlans
This function adds the meta-property to every state and a test if it is defined within tests. (see in example) Beside that it generates all possible test simple path plans for all possible combinations of your guards.
⚠️ Attention: Your statechart must consist of only string references to guards, actions and services otherwise the testing will break.
Example
// The following snippet does not include all needed imports and code it is intended// to give you a starting point and an idea how the `createTestPlans`-function can be used.import{createTestPlans,StatesTestFunctions}from'@smartive/xstate-test-toolbox';import{FetchInterceptor,mockHeaders,mockResponse,RequestCallCountMock}from'@smartive/testcafe-utils';import{TestEventsConfig}from'@xstate/test/lib/types';import{RequestMock}from'testcafe';import{Context,machine}from'./machine-under-test';// ...typeTestContext={t: TestController,plan: string,path: string};constfetchInterceptor=newFetchInterceptor({fetchPeople: /.+swapi\.dev.+\/people\/$/,fetchMore: /.+swapi\.dev.+\/people\/\?page=.+/,searchPeople: /.+swapi\.dev.+\/people\/\?search=.+/,});constgetRequestMocks=(plan: string,path: string): object[]=>{constpeopleUrl=/.+swapi\.dev.+\/people\/.*/if(plan.includes('NoResults')||(plan.includes('Searching')&&path.includes('NoResults'))){return[RequestMock().onRequestTo(peopleUrl).respond(empty,200,mockHeaders),];}if(plan.includes('Error')){switch(path){case'Pending → error.platform.fetchPeople':
return[RequestMock().onRequestTo(peopleUrl).respond({},400,mockHeaders),];case'Pending → done.invoke.fetchPeople → Idle → END_REACHED → LoadingMore → error.platform.fetchMore':
return[newRequestCallCountMock(peopleUrl,[{body: mockResponse(peoples)},{body: mockResponse({},400)},]),];case'Pending → done.invoke.fetchPeople → NoResults → QUERY_DISPATCHED → Searching → error.platform.searchPeople':
return[RequestMock().onRequestTo(fetchInterceptor.interceptUrls.searchPeople).respond({},400,mockHeaders),RequestMock().onRequestTo(peopleUrl).respond(empty,200,mockHeaders),];case'Pending → done.invoke.fetchPeople → Idle → QUERY_DISPATCHED → Searching → error.platform.searchPeople':
return[RequestMock().onRequestTo(fetchInterceptor.interceptUrls.searchPeople).respond({},400,mockHeaders),];}}return[];};consttests: StatesTestFunctions<Context,TestContext>={Pending: ({ t })=>t.expect(page.spinner.exists).ok(),Idle: ({ t })=>t.expect(page.listItem.count).gt(0),LoadingMore: ({ t })=>t.expect(page.listItem.count).gt(1).expect(page.spinner.exists).ok(),Error: ({ t })=>t.expect(page.error.exists).ok(),NoResults: ({ t })=>t.expect(page.notify.exists).ok(),Searching: ({ t })=>t.expect(page.search.value).contains('luke').expect(page.spinner.exists).ok(),};consttestEvents: TestEventsConfig<TestContext>={END_REACHED: ({ t })=>t.hover(page.listItem.nth(9),{speed: 0.8}),QUERY_DISPATCHED: ({ t })=>t.typeText(page.search,'luke',{speed: 0.8}),'done.invoke.fetchPeople': fetchInterceptor.resolve('fetchPeople'),'error.platform.fetchPeople': fetchInterceptor.resolve('fetchPeople'),'error.platform.fetchMore': fetchInterceptor.resolve('fetchMore'),'error.platform.searchPeople': fetchInterceptor.resolve('searchPeople'),};createTestPlans({
machine,
tests,
testEvents,// add logLevel: LogLevel.INFO for some output which plans/paths are generated}).forEach(({description: plan, paths })=>{fixture(plan).page(`http://localhost:3000/peoples`);paths.forEach(({test: run,description: path})=>{test.clientScripts([fetchInterceptor.clientScript()]).requestHooks(getRequestMocks(plan,path))(`via ${path} ⬏`,(t)=>run({ plan, path, t }));});});
http-tar-streamer is a simple HTTP server that allows you to stream tar archives of directories over HTTP. It supports both uncompressed and gzip-compressed tar archives.
Features
Streams tar archives of directories over HTTP, without requiring any extra space on server
Uses minimal resources, with memory consumption under 10MB
Supports both uncompressed and gzip-compressed tar archives
Provides a simple web interface that displays a list of directories in the current working directory when you navigate to the root URL “https://github.com/”
Allows you to download a tar archive of any directory by navigating to its URL with a .tar or .tar.gz extension
Cowardly refuses to serve files if the filename contains any separator like “https://github.com/” to prevent directory traversal attacks
Usage
To use http-tar-streamer, you can either run it directly from the command line or build it as a standalone binary.
Running from the command line
To run http-tar-streamer from the command line, use the following command:
go run main.go
This will start the server on port 8080 and serve the current working directory.
Building as a standalone binary
To build http-tar-streamer as a standalone binary, use the following command:
go build -ldflags "-s -w" -o bin/http-tar-streamer main.go
This will create a standalone binary named http-tar-streamer in the current working directory. You can then run the binary using the following command:
./bin/http-tar-streamer
This will start the server on port 8080 and serve the current working directory.
Downloading tar archives
To download a tar archive of a directory, navigate to the URL for that directory with a .tar or .tar.gz extension. For example, if you have a directory named mydir in the current working directory, you can download a tar archive of that directory using the following URLs:
If one of the above commands fail your operating system probably lacks some build essentials. These are usually pre-installed but if you lack them you need to install these. For instance, for Ubuntu this would require:
The pipeline produces at various steps JSON QC files (*.json.gz). You can upload and interactively browse these files at https://gear-genomics.embl.de/alfred/. In addition, the pipeline produces a succinct QC file for each sample. If you have multiple output folders (one for each ATAC-Seq sample) you can simply concatenate the QC metrics of each sample.
To call differential peaks on a count matrix for TSS peaks, called counts.tss.gz, using DESeq2 we first need to create a file with sample level information (sample.info). For instance, if you have 2 replicates per condition:
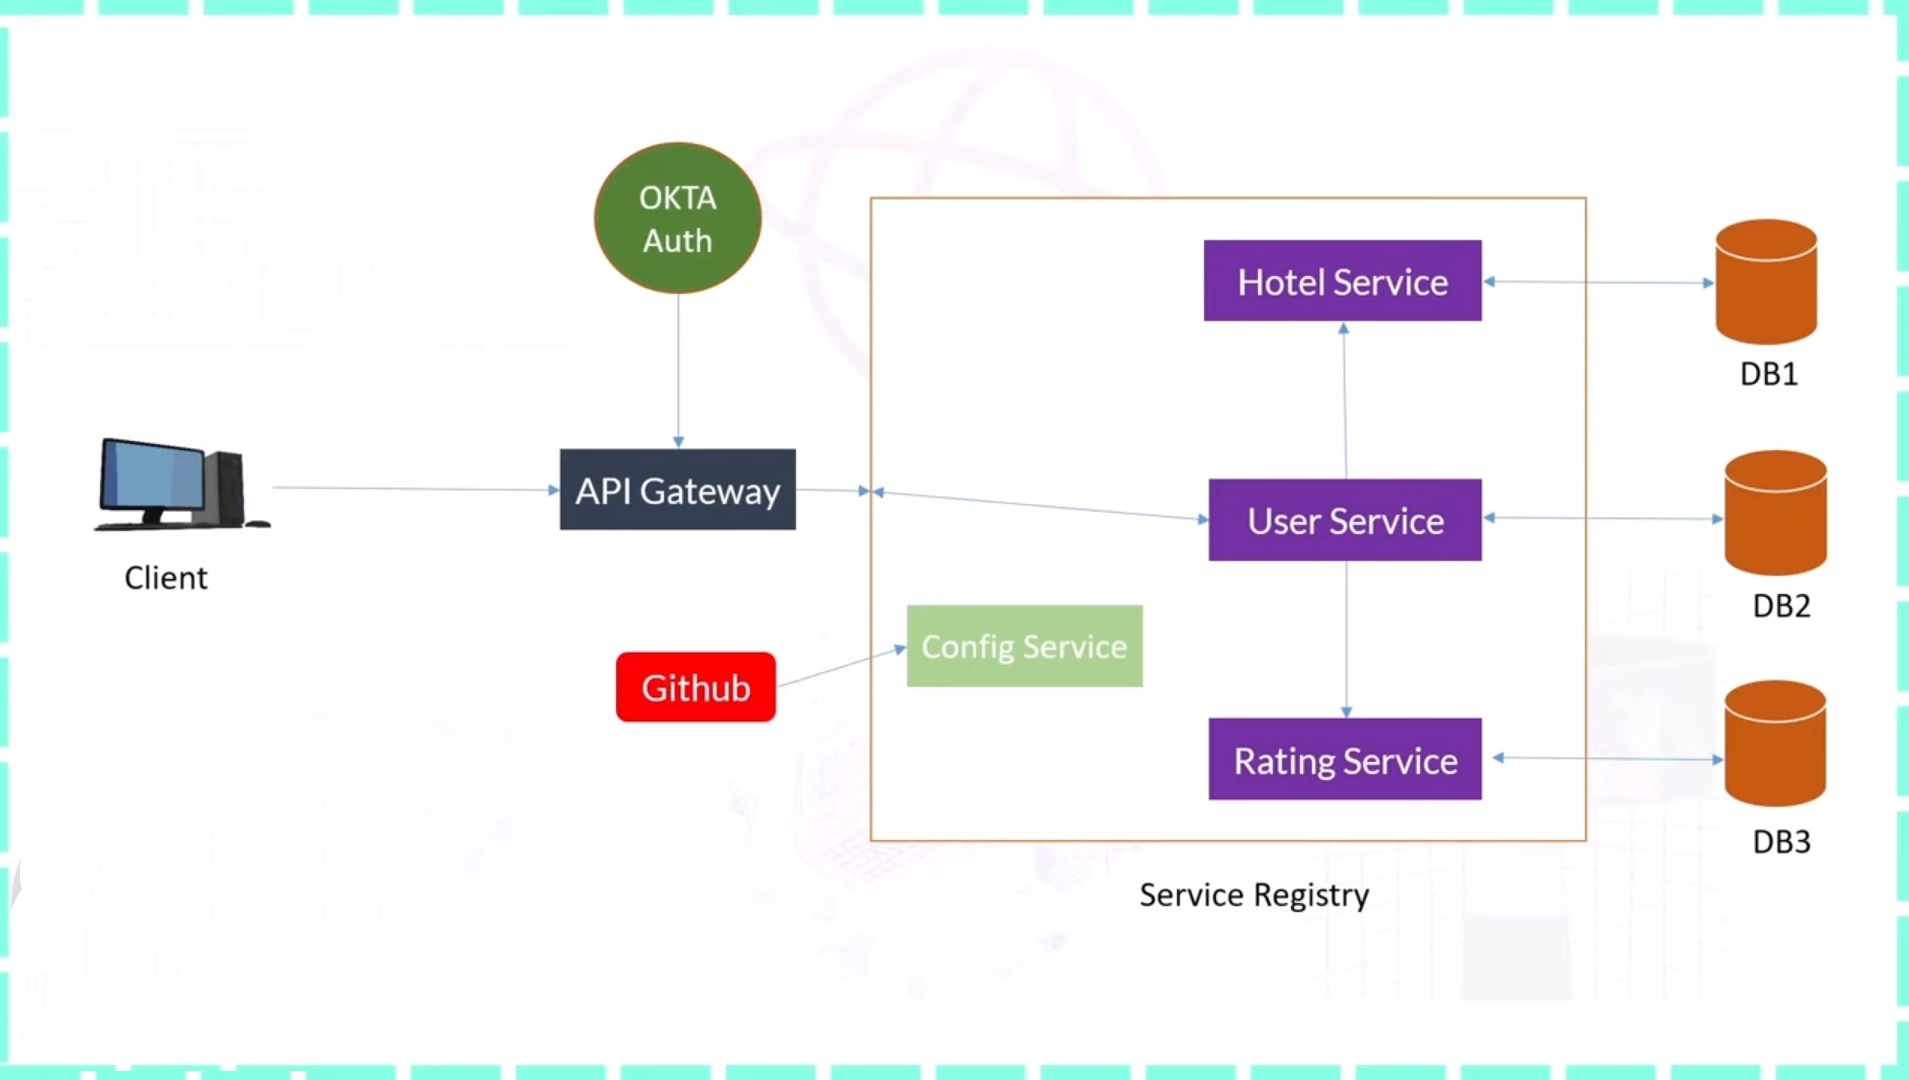
This codebase was created to demonstrate a backend application built with Java 11 + Spring Boot 3 including CRUD operations, authentication, routing and more.
This app helps users to rate a hotel services based on their experience. Once user is logged with correct email and password, he can post and see the reviews given by other users.
This app mainly contains 3 microservices-
UserServices: This service contains information about the user like his id, name and email.It uses MySQL as a database.
HotelServices: This service contains information about the hotel like his id, name, ratings given by users and feedback provided.It uses Oracle as a database.
RatingServices: This service provides ratings given to hotels based on userID and hotelId .It uses MongoDB as a database.
Apart from these services, Okta has been used to provide security to microservices.
Taking a closer look at the project structure, the main code of the application is located in the src/main/java directory. Additionally, configuration files and such can be found in the src/main/resources directory.
The core logic of the application is organized as follows:
~Controller: Processes HTTP requests, calls business logic, and generates responses.
~Service: Implements business logic and interacts with the database through Repositories.
~Repository: An interface for interacting with the database, implemented using Spring Data JPA.
Authentication and authorization management are implemented using Spring Security, with token-based authentication using Okta. Moreover, various features of Spring Boot are utilized to implement exception handling, logging, testing, and more.
Through this project, you can learn how to implement backend applications based on Spring and how to utilize various Spring technologies. Additionally, by implementing an application following the RealWorld specifications, it provides a basis for deciding which technology stack to choose through comparisons with various other technology stacks.
Architecture
Technologies
Spring Boot: Server side framework
JPA: Entity framework
Lombok: Provides automated getter/setters
Actuator: Application insights on the fly
Spring Security: Spring’s security
Devtools: Support Hot-Code Swapping with live browser reload